Use Diagnostics
Here you can view diagnostic logging for your system. The logging level is set in the Administration App (Data > All Settings > Log Level). Valid levels are Error, Warn, Info, Debug and Trace. Within the Diagnostics screen, the current logging level is outlined at the bottom of the page.
Additionally, you can manage the number of logs stored using the Max Logging Days setting, configured in the Administration App. The setting defaults to 7, but can be configured from a minimum value of 1 to a maximum of 30.
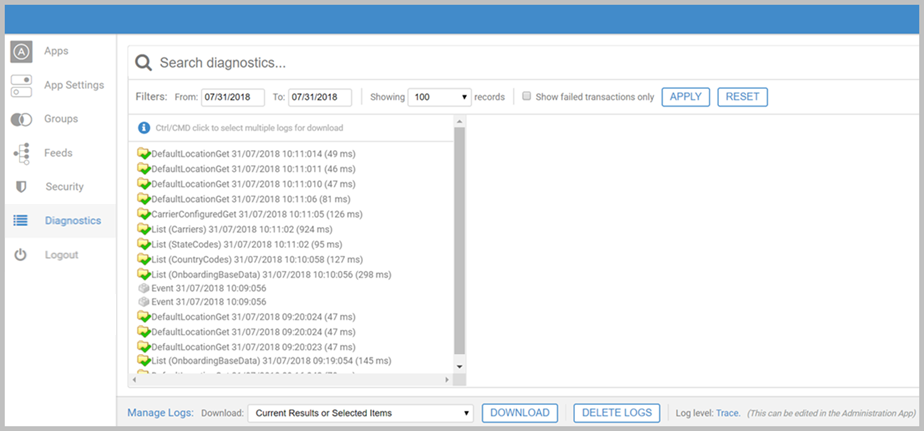
Filters
Use the Filters bar to determine the logs that will display. Select the date, or time period, and the number of records to display. Use the Show failed transactions only checkbox to filter logs by success. Additionally, you can use the search bar to filter logs using keywords. Note that you need to select APPLY to apply any new filters. Use RESET to change the filters back to the default configuration.
Manage Logs
Use the DOWNLOAD and DELETE LOGS icons to manage your logs. Downloading creates a zip file containing the relevant logs, and stores the files in the database.
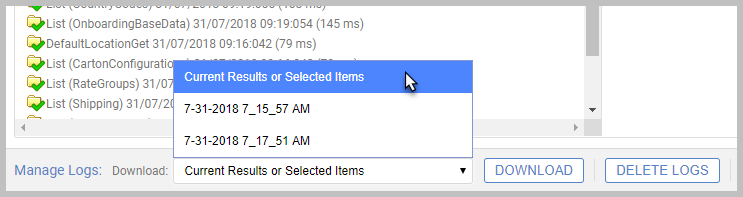
Use the Download: dropdown to determine which logs will be actioned. This can be set to:
- Current Results or Selected Items. This is the default option. Use Click and Ctrl/CMD to select multiple logs to manage.
- Stored zip files. Use this option to download previously created log zip files. Files are titled with the date and time of creation. The dropdown stores 10 entries.
The DELETE LOGS icon will delete all stored zip files and log entries from the database.