Use the EDI App
Use the EDI App to monitor your EDI activity. The App has two views, Dashboard, providing comprehensive detail on the status of your system at face value, and Messages which drives down into detail on a per shipment basis. In detail, you can:
- Assess the status of EDI transactions at the carrier and overall level.
- View graphs and analytics outlining EDI data.
- Filter or search data.
- View detail at a message level to gain the precise status of a shipment, including timeline, and any available notes or files.
- Download records for use outside the product.

Dashboard
Use the Dashboard view to quickly assess the status of EDI transactions at both the carrier and overall level. Filter results by date and time. The page shows:
- Total Exceptions - Displays all shipments in the specified time range that are classed as exceptions.
- Exceptions/ Total Request Responses - Shows the status of all shipments in the specified time range, categorized as Exceptions, Pending or Accepted.
- % Carrier Exceptions/ Total Exceptions - Each carrier's share of the total number of exceptions. Note that if a carrier doesn't have exceptions, it is not visible in the graph.
- % Exceptions/ Carrier - Outlines the exceptions percentages for each carrier, alongside the number of shipments to exceptions.
- % Unacknowledged Shipments/ Time - Shows the percentage of shipments in the specified time range that are awaiting responses.
Exception Thresholds
The Total Exceptions and % Exceptions/ Carrier graphs display color (red, yellow, green) to visualize the current exception levels. The percentage values at which the graphs alter color are dependent on global and carrier level settings.
- Total Exceptions is controlled by the EDI Global Threshold Percentage setting, configured in the All Settings page of the Administration App’s Data tab. Note that it defaults to 3.
- % Exceptions/ Carrier is set per carrier, and controlled by the EDI Carrier Exception Threshold (%) field. This is set during configuration in the Administration App’s Carrier tab. Note that it defaults to 3. If not configured at the carrier level, the EDI Global Threshold Percentage setting is used.

Exception Definitions
The time elapsed before a shipment is classed as an exception is determined by the SLA App setting, configured in Product Admin. Note that it defaults to 02:00:00 (2 hours). See All App Settings for detail.
Messages
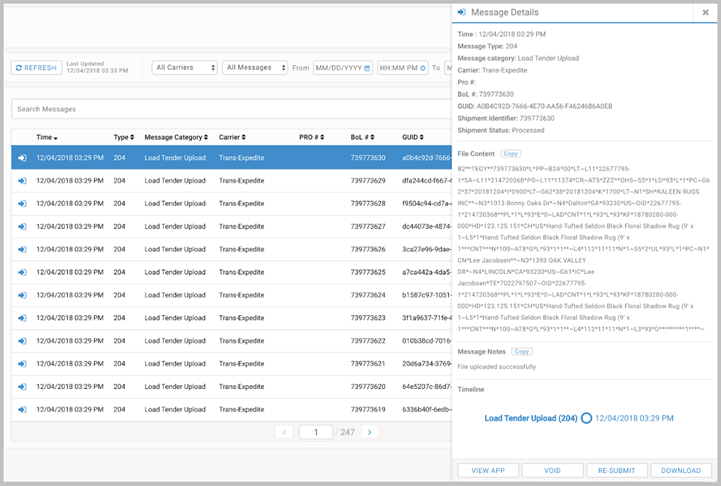
The Messages view provides more granular detail at the shipment level, and includes information on any errors. The data can be reordered, or filtered by carrier, message type, date and time. Alternatively, search using keywords. Use the DOWNLOAD button to download the current record set for use outside the product. The button is disabled if more than 600 results show, and enables when the data set is reduced.
Additional data can be accessed using the View Detail option in each row, triggering the Message Details popup.

Message Details - Key Points
- Any available File Content or Message Notes can be copied to your clipboard using the Copy button. If the shipment fails, details on the error is found in the Message Notes section.
- The Timeline section offers a graphical representation of EDI messages. The timeline displays four sections, the first and three latest. If there are more than four sections, missing elements are shown with dotted lines between the sections.
- VIEW APP. Opens the View App, where you can search for the shipment. Note the View App in use must exactly match the name specified in the View App Name App Setting, configured in Product Admin. See All App Settings for detail.
- VOID. Voids the shipment. Note that only shipments that have not received 214 messages can be voided.
- RE-SUBMIT. Re-submits the shipment. Note that only shipments that have not received 990 messages can be re-submitted.
- DOWNLOAD. Downloads all data for the shipment in a CSV file.
